วันพุธที่ 29 สิงหาคม พ.ศ. 2561

รายงานผลแบบคนยุค 4.0 กับ Dashboard

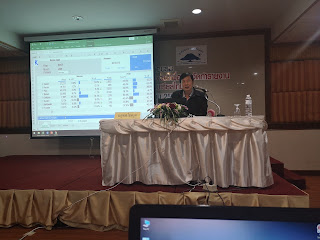
              ในการทำงานสำนักงานมีวิธีการเก็บข้อมูลอยู่มากมาย ได้แก่ การจดบันทึก การถ่ายภาพ และติดกล้องวงจรปิด  การเก็บข้อมูลหรือการจัดทำรายงานแบบ Dashboard ก็เปรียบเสมือนการเก็บข้อมูลผ่านกล้องวงจรปิด โดยที่ Dashboard คือหน้ากระดานที่ใช้ในการสรุปข้อมูลแบบแบบเรียลไทม์ ในมุมมองต่างๆ เพื่อให้สามารถดูได้ง่ายๆ ใช้เวลาในการตีความสั้นๆ และ ใช้ในการติดตามเรื่องที่สนใจ เพื่อเห็นการเปลี่ยนแปลงของข้อมูลตลอดเวลา และในการอบรมครั้งนี้มีการจัดทำ Dashboard .โดยใช้โปรแกรม Microsoft Excel ในส่วน Pivot Table, Pivot Chart

              การอบรม Dashboard ครั้งนี้ วิทยากร คือ อาจารย์สุเทพ  โลหณุต ผู้เชี่ยวชาญด้านการวิเคราะห์ระบบคอมพิวเตอร์ มหาวิทยาลัยเทคโนโลยีสุรนารี การจัดทำใช้โปรแกรม Microsoft Excel ในส่วน Pivot Table  และแบ่งเนื้อหาการอบรมเป็น  ส่วน ประกอบด้วย 1) แนวคิดการออกแบบและพัฒนางาน Dashboard Excel 2) พื้นฐานการใช้งานสูตรฟังก์ชั่น Dashboard Excel 3) การประยุกต์ใช้งาน Form Control สำหรับการออกแบบ Dashboard Excel 4) การออกแบบและพัฒนา Dashboard Excel 5) เติมเครื่องมือสรุปผลรวมของ Dashboard และ 6) การประยุกต์ใช้กราฟร่วมกับงาน Dashboard


              นอกจากนี้ วิทยากรได้แนะนำในการเลือกใช้กราฟให้เหมาะสมกับการนำเสนอ Dashboard ดังนี้ 1) กราฟแท่ง (Bar Chart) ใช้สำหรับแสดงผลความ โด่งคือ ยอดลักษณะสูงสุดและต่ำสุด และ 2) แผนภูมิวงกลม (Pie Chart) ใช้สำหรับแสดงผล สัดส่วนและ 3) กราฟเส้น (Line Chart) ใช้สำหรับแสดงผลความ รุ่งหรือร่วงคือ แนวโน้ม (Trend) ทั้งนี้สามารถดาวน์โหลดเอกสารเพิ่มเติมจากเว็บไซต์ของวิทยากร คือ http://thep2train.com/word2train 

วันพฤหัสบดีที่ 21 ธันวาคม พ.ศ. 2560

ถอดบทเรียน Big Data ใหญ่ขนาดไหนกัน

(ถอดบทเรียนจากการอบรม 13 ธ.ค. 60)
Big Data คือ กระบวนการวิเคราะห์ข้อมูลขนาดใหญ่ แล้วคำว่า “ใหญ่” จะต้องใหญ่ขนาดไหนกัน การทำ Big Data ไม่สำคัญว่าข้อมูลจะใหญ่ขนาดไหน สำคัญที่คุณค่าของการนำข้อมูลไปใช้ โดยมีองค์ประกอบทั้งหมด 4 ข้อ คือ 1) Data 2) Strategic Thinking 3) องค์ความรู้ในการวิเคราะห์ (Domain Knowledge) ได้แก่ statistics, Data Mining, Machine Learning, Deep Learning และ 4) Tool ได้แก่ manual  machine เช่น software ในการอบรมใช้ซอฟต์แวร์ Power BI และมีการสาธิตใช้ Python
สิ่งสำคัญอีกอย่างหนึ่ง คือ การหาโจทย์ (Question) ในการมาวิเคราะห์ ซึ่งสามารถหาได้ ดังนี้
1.      ปัญหา (Problem) เช่น ปัญหาที่เกิดขึ้นบ่อย หรือ ปัญหาที่เกิดขึ้นนานทีแต่ไม่หนัก
2.      KPI
3.      คู่แข่ง
4.      นโยบายของผู้บริหาร

สถิติ, เวิร์ดเพรส, เว็บ, ข้อมูล, ซม, เว็บไซต์

ตัวอย่าง
11. Question เอามาจาก KPI อัตราการลาออกไม่เกิน 2%
22. Data   ได้แก่
-          Profile บุคลากร
-          ผลการประเมินองค์กร> พนักงาน
-          ผลการประเมินพนักงาน>องค์กร
-          ปริมาณงาน (Work Load)
-          รายได้บุคลากร
33. Strategic thinking หรือ strategic Question (สามารถนำไปตั้งเป็นวัตถุประสงค์วิจัยได้)
-          เปอร์เซ็นต์ของคนที่ลาออก>Descriptive
-          ปัจจัยอะไรที่มีผลต่อการลาออก>Diagnose
-          ทำนายคนที่กำลังจะลาออกได้หรือไม่>Predict
-          แนวทางการธำรงรักษาบุคลากร>Prescriptive
44. ขั้นตอนการวิเคราะห์ข้อมูล
4.1 เตรียมข้อมูลดิบ
4.2 ทำความสะอาดข้อมูล
4.3 สำรวจข้อมูล
4.4 สร้างโมเดล จากรูปแบบความสัมพันธ์ของข้อมูล
4.5 แปลผล

เพิ่มเติม วิทยากรได้แนะนำในส่วนซอฟต์แวร์และเว็บไซต์
1)     Zoom It ซอฟต์แวร์ใช้ในการย่อขยายการนำเสนองาน
2)     www.Kaggle.com เว็บไซต์เกี่ยวกับ Big Data

3)     www.gps-coordinates.net เว็บไซต์หาพิกัด GPS

วันพฤหัสบดีที่ 17 พฤศจิกายน พ.ศ. 2559

Assessment of Thasap Model Project

       The results of academic service project assessment in Thasap sub-district (figure ), which was researched by CIPP model, were as follow:

1) C: Context
 Context was assessed by committees, it was found that overview assessment were at the high level (X= 3.86, S.D. = 0.96). The most subject which respondents assessed was suitability and consistency was project’s rationale, objectives and goal at the highest level (X = 4.22, S.D. = 0.97). Secondary, project atmosphere, such as environment, places etc., at the high level (X = 3.89, S.D. = 0.78).

2) I: Input
 Input was assessed by committees and project responsible. Committees’ assessment, it was found that overview assessment were at the high level (X= 3.37,      S.D. = 0.89). The most subject which respondents assessed suitability and consistency was quantity of personnel at the high level (X = 3.79, S.D. = 0.60). Secondary, project budget, at the high level (X = 3.89, S.D. = 0.33). And project responsible, it was found that overview assessment were at the high level (X= 3.62, S.D. = 0.63). The most subject which respondents assessed suitability and consistency was quantity of personnel at the high level (X = 4.11, S.D. = 0.60). Secondary, project budget, at the medium level         (X= 3.30, S.D. = 1.05).

3) P: Process
 Process was assessed by project responsible, it was found that overview assessment were at the high level (X= 3.41, S.D. = 1.01). The most subject which respondents assessed suitability and consistency was completeness of activities procedures at the high level (X = 3.61, S.D. = 0.93). Secondary, activities planning at the high level  (X = 3.58, S.D. = 1.03).

4) P: Product
 Product was assessed by attendees; include school teachers and administrators, students, youth groups, general people, and career, farmer, and elderly groups.  1) School teachers and administrators assessed overview at the high level (X= 3.79, S.D. = 0.76). The most subject which respondents assessed satisfaction was knowledge and ability of keynote speaker at the high level (X = 3.83, S.D. = 0.82). Secondary, building network at the high level (X = 3.83, S.D. = 0.68). 2) Students assessed overview at the high level      (X = 4.07, S.D. = 0.89). The most subject which respondents assessed was survey need of before doing project the highest level (X = 4.20, S.D. = 0.86). Secondary, knowledge and ability of keynote speaker at the high level (X = 4.09, S.D. = 0.91). 3) Youth groups assessed overview at the high level (X = 4.35, S.D. = 0.68). The most subject which respondents assessed was overview satisfaction at the high level (X = 4.30, S.D. = 0.69). Secondary, building network at the highest level (X = 4.27, S.D. = 0.68). 4) General people assessed overview at the highest level (X = 4.02, S.D. = 0.65). The most subject which respondents assessed was utilization knowledge from project at the highest level    (X = 4.30, S.D. = 0.69). Secondary, processes and procedures of activities at the highest level (X = 4.33, S.D. = 0.71). And 5) career, farmer, and elderly groups assessed overview at the high level (X = 4.17, S.D. = 0.72). The most subject which respondents assessed was overview satisfaction at the highest level (X = 4.31, S.D. = 0.70). Secondary, knowledge and ability of keynote speaker at the highest level (X = 4.26, S.D. = 0.71).

วันเสาร์ที่ 2 กรกฎาคม พ.ศ. 2559

Academic Community Service Project in Thasap Sub-district, "THASAP MODEL"

The Chancellor of the Yala Rajabhat University had a policy of academic service that “Thasap Model Project”, which emphasizes service for people in Thasap sub-district, Muang, Yala. The project was developed by integration all of sciences to contribute for improving life quality and build strong and sustainable communities in the area. Formerly, the university did a project name as “One Faculty One Area”, which one of area-based project and it spread in Yala and Pattani areas. The chancellor has a concept a project to develop clearly and more concrete, so he found and chose an area, Thasap.  The project did for development Thasap sub-district will be a community model for other people. 

The project had four-stage PDCA model, as shown in figure 1, for continuous improvement include: 
1) P: plan was preparation conference, exploring problem and need of community, coordination plan with local government organization and presentation project proposal. 
2) D: do projects as required the university plan. 
3) C: check actual results. 
4) A: act by implementing the improved solution fully. 


The roadmap of Thasap Model project has 4 years as shown in figure 2. First, learning:  responsible do each project and learn basic information need. Next, group creation by the university is a helper for making a model group. In addition, group development, creation medium level group and spreading to other group, so indicators of this year are learning source and network. Last, completely group, a desirable and self-sufficiency community. There are 5 indicators are learning source, network, course, handbook and model group.

Credit: 
http://srdi.yru.ac.th/thasapmodel/ 

นิทรรศการหนึ่งโรงเรียนหนึ่งผลิตภัณฑ์ (OSOP)

เมื่อวันที่ 14 มีนาคม 2557 ที่ผ่านมา ทีมงานจากสถาบันวิจัยและพัฒนาชายแดนภาคใต้ มหาวิทยาลัยราชภัฏยะลา นำโดย ดร.รุ้งลาวัณย์  จันทรัตนา ผู้อำนวยการสถาบันวิจัยและพัฒนาชายแดนภาคใต้ พร้อมด้วยอาจารย์เวคิน  วุฒิวงศ์ รองผู้อำนวยการฝ่ายบริการวิชาการ นางสาวริซมา  สาเม๊าะ  นักวิชาการศึกษา และนางสาวฟาดีล๊ะ  สาเมาะ เจ้าหน้าที่โครงการ ลงพื้นที่เทศบาลตำบลนาประดู่ อำเภอโคกโพธิ์ จังหวัดปัตตานี เพื่อเยี่ยมชมการจัดนิทรรศการของโรงเรียนเครือข่ายเศรษฐกิจพอเพียงที่ได้ทำ MOU กับสถาบันวิจัยและพัฒนาชายแดนภาคใต้ โดยได้การต้อนรับจาก นายสม พุ่มแก้ว รองผู้อำนวยการสำนักงานเขตพื้นที่การศึกษาประถมศึกษาปัตตานี เขต 2 และนายชาญชัย  เกียรติศักดิ์โสภณ นายกเทศมนตรีตำบลนาประดู่ 
กิจกรรมดังกล่าวเป็นการต่อยอดจากการทำบันทึกข้อตกลงความร่วมมือในโครงการบริการวิชาการ “โครงการพัฒนาเครือข่ายความร่วมมือเพื่อส่งเสริมคุณภาพชีวิตตามแนวคิดเศรษฐกิจพอเพียง”  ในงานดังกล่าวมีโรงเรียนเครือข่ายที่เข้าร่วมจัดนิทรรศการ ประกอบด้วย โรงเรียนบ้านควนโนรี โรงเรียนบ้านป่าไร่ และโรงเรียนบ้านโคกเหรียง อำเภอโคกโพธิ์ จังหวัดปัตตานี